Debug Decompiled Smali Code in Android Studio 3.2
11 Nov 2018Intro
Being able to peek into what data are in memory of the app you are currently reverse engineering and step through its code are really useful features and Android Studio with smalidea plugin allows you exactly that. The steps to realize that were already described by smalidea authors on GitHub or in more details in CROSP’s article. These instructions, however, require DDMS which has recently deprecated. In this post, I want to show you an alternate way of debugging your smali code which works in latest Android Studio 3.2 without DDMS.
Prerequisites
- Android Studio 3.2
- Android Emulator or real Android device
- APK of application you want to debug
- Apktool (I use version 2.3.3)
- Java SDK
1) Install smalidea plugin
Let’s start by ripping off CROSP’s article as I believe it’s better to repeat the parts that are common here than to force you to jump between two articles.
Open up Android Studio and you should see the welcome screen like the one on screenshot bellow (if not, close your current project by selecting File -> Close project).
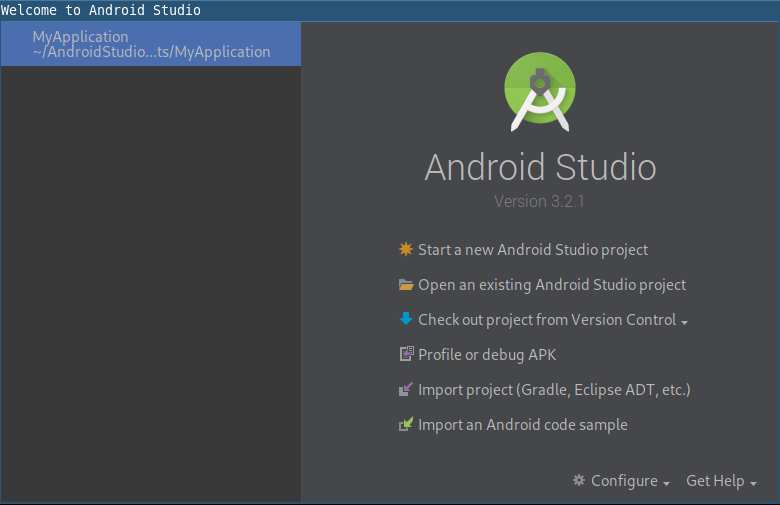
On the welcome screen, select Configure -> Plugins which opens up a Plugin’s window. There, you can install smalidea by providing the path to plugin’s ZIP file (download here) using Install plugin from disk... button. After installation Android Studio will ask you to restart it so go for it.
2) Decompile APK
In this tutorial, I’ll use open-source app LeafPic by HoraApps (thank you!) though you’d probably reverse engineer some closed-source app. I’ve built APK of this app in release config as it’s more realistic and now I’m going to pretend I don’t have the source code.
Having no source, we unpack and decompile out APK to smali:
# unpack and decompile whole APK to be patched later
apktool d application.apk -o re_project0/

# create folder for all decompiled smali sources
mkdir -p re_project0/src

# copy all the smali code to sources folder
cp -R re_project0/smali*/* re_project0/src
3) Import Smali Project to Android Studio
Go to Android Studio’s welcome screen again and this time select Open an existing Android Studio project and select re_project0/ folder where you unpacked APK.
Once project loads, you need to tell the IDE where is your source code. First, you need to switch to Project view by clicking on Android in the left side panel. Then a menu, as on the screenshot below, appears and you’ll select Project.
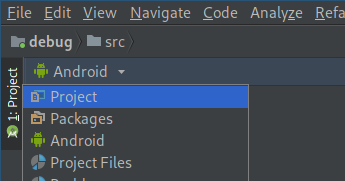
Now you can see folder structure in your left panel. Find src/ subfolder right click it and select Mark Directory as -> Sources Root.
4) Prepare App for Debugging
Most of the apps you’ll try reverse engineer won’t allow you to debug them straight away as they are not debuggable. Fortunately, usually, that is no issue 1 as you can rebuild the APK with correct android:debuggable flag.
To do that, you should go to your re_project0/, open AndroidManifest.xml in your favorite text editor and locate XML element <application>. This element will have number of attributes but you don’t care about these at the moment, you just need to make sure there is attribute android:debuggable with value true as in this example:
<application android:debuggable="true" android:allowBackup="true" android:icon="@mipmap/ic_launcher" android:label="@string/app_name" android:largeHeap="true" android:name="org.horaapps.leafpic.App" android:theme="@style/Theme.AppCompat">
After you made the change, you should repack the application back to APK using apktool like this:
apktool b re_project0/
Your patched APK will be in re_project0/dist directory. From there you can install it using adb install patched.apk, just remember to sign it first 2.
5) Prepare Android Device for Debugging
Once your debuggable APK is installed, you need to make changes in your real/emulated Android device.
First, connect your USB cable or start your emulator and make sure you have adb access to your device - you can verify using adb shell.
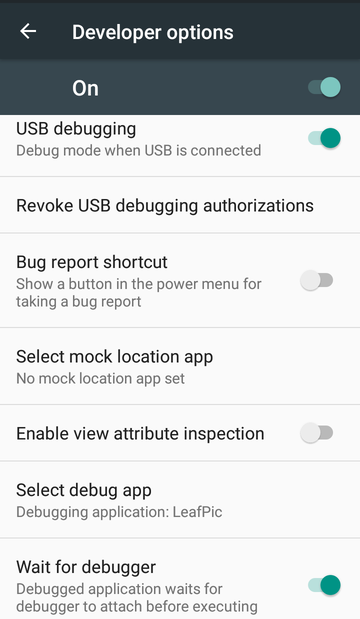
Then, in your Android, go to Settings -> Developer options 3 and set USB debugging and Wait for debugger options on. The latter is optional but useful as it allows you wait for debugger connection and not to run app yet.
Finally, you should tap on Select debug app and choose your debuggable app. After all of these, your Developer options menu should look somewhat like this:
All is set there, go ahead and start your application. The app should get stuck waiting for a debugger with a dialog looking like this one:
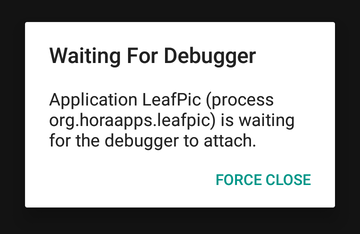
Everything is cool, the application is waiting for debugger but there is one last step remaining. As the application is listening for debugger’s connection on localhost of Android device, we need to somehow forward it to our host where Android Studio is running.
We’ll use adb’s port forwarding feature here and forward JDWP service where application’s debug interface is listening (found from adb jdwp) to TCP port 5005 on host system using this: 4
adb forward tcp:5005 jdwp:$(timeout 0.5 adb jdwp | tail -n 1)
5) Connect Debugger
After finishing following last steps, the debugger attaches to your app and runs the application so this is the right time to place your breakpoints in smali code.
Ready? Ok, go back to Android Studio and from its top menu bar choose Run -> Debug, then a small Debug menu window appears so click on its item Edit Configurations.... There, using a plus button, add new configuration of type Remote. Leave the default configuration as is but change port to the one you used previously, in my case it is 5005. Click the Debug button and your app should be running with the attached debugger which means it will stop once a breakpoint is hit and you can investigate the content of app’s variables.
6) Profit
Or not, it’s up to you how useful you make it. For me, it was really handy when I was reverse engineering a custom HTTP request signing scheme without source code and ProGuard minification turned on. I was not able to understand it just by looking at the decompiled code, dynamic analysis gave me more insight and I finally realized what was going on.
Side notes
- 1 By modifying the original APK you, of course, get another application. It may behave like the original for most of the times but you cannot be sure it’s 100% times.
- 2 See Xamarin’s tutorial if you’ve never manually signed APK before.
- 3 If you don’t see
Developer optionsanywhere in the menu it might not be activated yet, follow docs to see how to enable it. - 4 There can be more applications listening using JDWP. If you don’t know what’s wrong you might be forwarding different app’s debug service. List all listening apps with
adb jdwpand verify you use the correct one.